Tag: comparison

  • Google AI Mode vs. ChatGPT Search: Which AI Search Tool Actually Helps?

    Google AI Mode vs. ChatGPT Search: Which AI Search Tool Actually Helps?

    Two of the biggest names in tech are now fighting over the future of search. Google has rolled out AI Mode, a conversational layer on top of its classic search engine, while OpenAI has turned ChatGPT into a full-fledged search tool. Both promise to replace the old list of blue links with direct, reasoned answers. But they go about it in very different ways.

    One is a search engine with a chatbot grafted on. The other is a chatbot with a search engine tucked inside. That difference shapes everything: how you ask questions, how you follow up, and how much you trust the answers. Here’s a side-by-side look at what each tool actually does, where they stumble, and which one might suit the way you work.

    The Short Version: What Each Tool Is

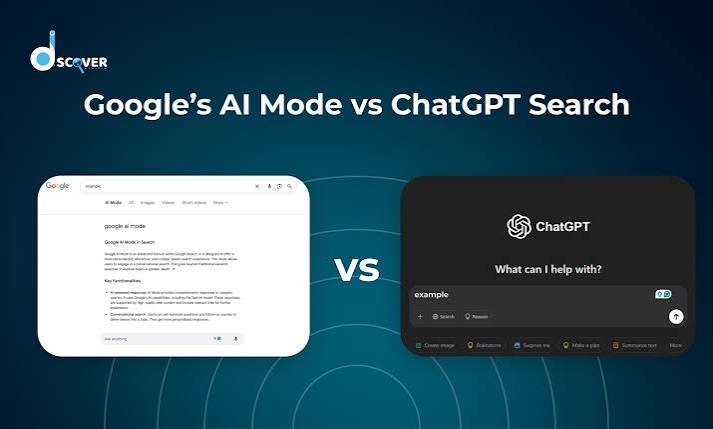
    Google AI Mode is an opt-in feature inside Google Search, available through Search Labs since March 2025. It uses a custom Gemini 2.0 model to answer complex, multi-step questions directly on the search results page. You type a query like “compare the best OLED TVs for gaming under $1,000,” and instead of links, you get a synthesized comparison with sources cited.

    ChatGPT Search is a built-in feature in ChatGPT, available to all users since late 2024. It uses a fine-tuned GPT-4o (or GPT-4.1) model with a browsing tool that queries Bing’s index and other sources. You ask a question in the chat window, and it responds conversationally with footnoted sources. You can ask follow-up questions in the same thread, refining your search iteratively.

    The core distinction: AI Mode is a search engine that talks; ChatGPT Search is a talker that searches.

    Search Index: The Foundation of Everything

    Google’s index is the largest and most comprehensive in the world, covering billions of pages with real-time updates. AI Mode taps directly into that index, pulling live prices, stock quotes, local inventory, and other fresh data. ChatGPT Search, by contrast, relies primarily on Bing’s index, which is smaller and sometimes less current. OpenAI has been building its own web crawler (GPTBot), but for now, Bing remains the backbone.

    This matters for queries that depend on the latest information. If you ask about a breaking news event or a rapidly changing product price, Google AI Mode has the edge because its index is simply bigger and fresher. ChatGPT Search can still access real-time data through partnerships with news providers like the Associated Press and Reuters, but the underlying index is not as deep.

    Interface: Familiar vs. Conversational

    Google AI Mode lives in a dedicated tab within the Google app or search page. The layout feels familiar—a search bar, a results page—but the answer appears as a paragraph or bulleted list at the top, with links to sources alongside. There’s also a “show thinking” toggle that displays the model’s reasoning steps, a transparency feature that can be illuminating or overwhelming, depending on your patience.

    ChatGPT Search is integrated into the chat interface itself. You don’t need to switch tabs or modes; just ask a question and the model decides whether to search. The answer comes back in a chat bubble with numbered footnotes. You can then ask follow-up questions like “What about the Samsung S90D?” and the model remembers the context. This conversational flow is a major advantage for complex, multi-turn research.

    Follow-Up Questions: The Biggest Practical Difference

    The ability to refine a query is where these tools diverge most. With ChatGPT Search, you can have a back-and-forth dialogue. Ask about OLED TVs, then narrow down by budget, then ask about a specific brand, and the model keeps the thread. This is how real research works—you start broad and drill down.

    Google AI Mode, at least in its current form, is more rigid. Each query is treated as a new search. You can’t say “actually, just the ones under $800” and expect it to remember the previous context. You have to start over or rephrase the entire question. The “show thinking” toggle does reveal the model’s internal reasoning, which can help you understand why it gave a particular answer, but it doesn’t allow for iterative refinement in the same way.

    For a single, complex query, AI Mode shines. For an ongoing research session, ChatGPT Search is far more practical.

    Source Presentation and Trust

    Both tools cite their sources, but they do it differently. Google AI Mode shows inline links within the answer and a separate source panel on the side. This makes it easy to click through and verify claims. ChatGPT Search uses footnote citations—small numbers that you can hover over or click to see the source. It’s unobtrusive but requires an extra step to check.

    Trust is a bigger issue for AI-generated answers than for traditional links. Google has the advantage of brand familiarity and a long track record of search quality. ChatGPT, on the other hand, is a newer entrant but has built trust through its conversational accuracy and transparency about sources. Both are susceptible to hallucination, but the underlying model’s reliability matters more than the interface.

    Pricing and Access

    Google AI Mode is free but requires opting in via Search Labs. It’s not available to everyone by default. ChatGPT Search is free for all users, with rate limits for the free tier; Plus and Pro subscribers get higher limits and priority access. So, out of the box, ChatGPT Search is more accessible—you just open ChatGPT and start asking.

    Business Models and Future Direction

    Google’s AI Mode is ad-free for now, but Google has tested ads in AI Overviews, its earlier AI feature. It’s likely that AI Mode will eventually include sponsored answers or product listings, which could affect the neutrality of results. OpenAI, meanwhile, has no plans for ads in ChatGPT Search. Its revenue comes from subscriptions and API usage, so the priority is keeping users engaged and paying.

    This difference shapes the long-term experience. Google has a financial incentive to push ads, while OpenAI has an incentive to provide the best possible answer to retain subscribers. That’s not to say Google will sacrifice quality, but the ad model is a fundamental part of its business.

    Which One Should You Use?

    There’s no single winner—it depends on how you search.

    • For one-off, complex queries: Google AI Mode is excellent. Ask it to compare products, explain a nuanced topic, or synthesize multiple sources, and you’ll get a well-cited answer fast.
    • For ongoing research projects: ChatGPT Search is the better companion. The ability to ask follow-up questions in the same thread is a game-changer for deep dives.
    • For the freshest data: Google AI Mode, thanks to its larger index.
    • For accessibility: ChatGPT Search, because it’s free and always available.

    Try both. You’ll likely find that each has a place in your workflow. The AI search war is just beginning, and the winners will be the ones who make it easiest to find accurate information—whether that’s through a search box or a chat window.

    Google AI Mode and ChatGPT Search represent two philosophies of AI search: one that enhances the traditional search experience, and one that reimagines it as a conversation. For now, Google AI Mode offers deeper and fresher data, while ChatGPT Search offers a more flexible and interactive way to get answers. As both products evolve—and as OpenAI builds its own index and Google refines its conversational abilities—the gap will likely narrow. But for your daily research needs, the choice comes down to a simple question: do you want to search, or do you want to chat?

    Summary

    • Google AI Mode is an opt-in feature in Google Search that uses Gemini 2.0 to provide conversational, multi-step answers with a “show thinking” toggle.
    • ChatGPT Search is a built-in feature in ChatGPT using GPT-4o with browsing, offering conversational answers with footnote citations and full follow-up context.
    • Key difference: AI Mode uses Google’s massive index; ChatGPT Search relies on Bing’s index (smaller but with news partnerships).
    • User experience: AI Mode is a search engine that talks; ChatGPT Search is a chatbot that searches, allowing iterative refinement.
    • Access: Both are free, but AI Mode is opt-in via Search Labs, while ChatGPT Search is available to all users by default.

    FAQ

    Q: Is Google AI Mode free?
    A: Yes, Google AI Mode is free, but it requires opting in via Search Labs. It’s not available to everyone by default.

    Q: Can I use ChatGPT Search for free?
    A: Yes, ChatGPT Search is free for all users, though free tier has rate limits. Plus and Pro subscribers get higher limits and priority access.

    Q: Which one has fresher data?
    A: Google AI Mode uses Google’s proprietary index, which is larger and updated more frequently. ChatGPT Search relies primarily on Bing’s index, though it has partnerships with news providers for real-time data.

    Q: Can I ask follow-up questions in Google AI Mode?
    A: Not really. Each query is treated as a new search. ChatGPT Search allows full conversational follow-ups in the same thread.

    Q: Does Google AI Mode show ads?
    A: Currently, AI Mode is ad-free, but Google has tested ads in AI Overviews, so ads may come later. ChatGPT Search has no ads and no plans to add them.

  • AI Search vs. Traditional Search: Which One Actually Serves You Better?

    AI Search vs. Traditional Search: Which One Actually Serves You Better?

    When you need an answer, do you type keywords into Google, or do you ask ChatGPT? That choice shapes how you get information, how much you trust it, and how long it takes. Traditional search and AI search are fundamentally different experiences, and knowing the difference can save you time and frustration.

    For over two decades, traditional search has been the default: type a few words, scan a list of blue links, click, refine. But since late 2022, AI search has emerged as a serious alternative, offering direct answers and conversational follow-ups. By 2026, Gartner predicts traditional search volume will drop by 25% as AI chatbots take over more queries. Yet, each approach has clear strengths and weaknesses. This article breaks down the real user experience differences not the hype so you can choose the right tool for the task.

    The Core Difference: Links vs. Answers

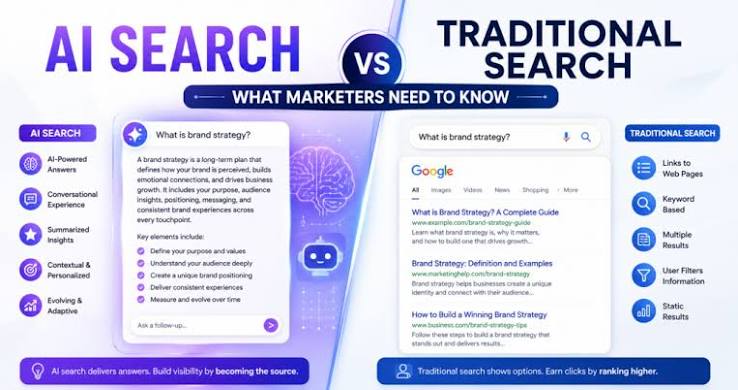
    Traditional search is built around the SERP—the search engine results page. You enter keywords like “best budget laptop for video editing,” and Google returns a ranked list of blue links, with sponsored results at the top. The system is transparent: you see exactly which websites appear, and you can jump in and out of them. The trade-off is that you do the work—scanning, clicking, and comparing.

    AI search, on the other hand, uses retrieval-augmented generation (RAG) to pull content from the web and then synthesizes it into a direct answer. In Perplexity or ChatGPT, you can ask a full question in natural language: “What’s the best budget laptop for video editing in 2025?” The AI returns a concise, cited response that combines multiple sources. No need to click through a dozen tabs.

    That basic shift—from a list of options to a single answer—changes everything about the experience.

    Speed vs. Depth: The Time-to-Answer Trade-off

    AI search wins on raw speed. A well-formed query can produce a solid answer in seconds, with citations. For instance, ask ChatGPT “Summarize the key differences between OLED and QLED TVs,” and you’ll get a bulleted comparison immediately. Traditional search would require you to open multiple reviews and cross-reference specs yourself.

    But speed can come at the cost of depth. Traditional search exposes you to a diversity of perspectives, letting you serendipitously discover a niche blog or a critical review that an AI might have flattened. AI compresses information, which can be great for a quick overview, but it may also lose nuance or over-rely on a few popular sources.

    Consider this scenario: You need to find the official opening hours for a local museum. Traditional search gives you the museum’s website as the top result, and you click through to confirm. AI might also get it right, but if it hallucinates the hours, you could show up to a closed door. For time-sensitive, factual queries, traditional search’s direct access to the source is safer.

    Control and Refinement: Who’s in the Driver’s Seat?

    Traditional search puts you in control. You refine your query with precise keywords:
    – “best budget laptop for video editing” → “best budget laptop for video editing under $800” → “best budget laptop for video editing under $800 with 16GB RAM.”

    You see the URLs, and you can assess the credibility of each source. The process is iterative, and you always know why a result appeared.

    AI search, by contrast, uses conversational context to remember your previous questions. You can say, “What about under $800?” and the AI knows you’re still talking about laptops. This is a huge advantage for multi-step research. But it also requires prompt engineering—you have to learn how to phrase questions clearly to get the best results. Vague questions can lead to broad or useless answers.

    For users who struggle with keyword formulation—non-native speakers, people with low literacy, or those with disabilities—AI’s natural language interface is a game-changer. It removes the barrier of guessing the “right” words.

    Trust: Sources vs. Citations

    Traditional search is transparent about its sources. You see the domain, the snippet, and the page rank. You can judge whether a result comes from a reputable news outlet or a random blog. The system doesn’t “make up” information—it only surfaces what exists.

    AI search relies on source citation and the model’s confidence. Perplexity and ChatGPT show numbered references, which is a step in the right direction. But AI can still hallucinate—confidently generate false information, especially on niche topics or recent events. A 2024 study found that AI Overviews in Google returned incorrect information for 27% of queries tested. That’s a trust risk you don’t have with traditional search.

    However, AI’s synthesis can also be more useful for complex questions. For “Explain the differences between Keynesian and supply-side economics,” an AI can generate a coherent summary that weaves together multiple sources, while traditional search gives you links to Wikipedia, Investopedia, and a few academic papers—leaving you to do the synthesis.

    The Hybrid Reality: Most People Use Both

    The truth is, most users aren’t choosing one over the other. They use both, depending on the task:

    • AI for synthesis: “Summarize this article,” “Compare these two products,” “Explain this concept.”
    • Traditional for verification: Checking official sites, local hours, shopping, and breaking news.
    • Traditional for serendipity: When you want to explore broadly and stumble upon unexpected sources.
    • AI for follow-ups: When you need to drill down on a topic through a conversation.

    A 2025 survey found that 70% of users who tried AI search still used traditional search for at least half of their queries. The key is matching the tool to the job.

    The Skeptical View: Echo Chambers, Ads, and Privacy

    AI search isn’t without its critics. Three main concerns stand out:

    1. Echo chamber risk: Because AI models are trained on popular web content, they may over-represent mainstream perspectives and under-represent fringe or minority viewpoints. Traditional search, for all its flaws, at least shows you a messy, diverse web.
    2. Ad creep: AI search is already monetizing. Perplexity has introduced sponsored follow-up questions, and Google AI Overviews include ads. This could eventually replicate the same ad-driven biases that plague traditional search.
    3. Privacy: Conversational AI retains your query history and context to provide continuity. That’s a privacy trade-off compared to traditional search, where you can browse anonymously or use incognito mode.

    These issues don’t mean AI search is bad—they mean you should be aware of the costs.

    What the Data Says About the Shift

    Gartner’s prediction of a 25% drop in traditional search volume by 2026 is a big deal. It’s driven by younger users: Gen Z already prefers TikTok and AI chat for discovery. But the shift isn’t a complete replacement. Traditional search remains dominant for transactional and local queries—the stuff of daily life.

    For now, the best strategy is to be bilingual in search. Use AI when you need a fast, synthesized answer. Switch to traditional when you need to verify, explore, or find a specific website. The user experience is no longer about one search box—it’s about choosing the right tool for the right moment.

    AI search and traditional search are not enemies—they’re different tools for different jobs. AI is faster and more conversational, but it can hallucinate. Traditional search is transparent and reliable, but it’s slower and requires more effort. The smartest approach is to use both, matching the tool to the task. As AI improves and becomes more integrated, the line will blur, but your role as a savvy user is to stay in control of how you seek information.

    Summary

    • AI search provides direct, synthesized answers via natural language, saving time but risking hallucinations.
    • Traditional search offers transparent, source-visible results, giving users control but requiring more manual effort.
    • Hybrid usage is common: AI for synthesis and traditional for verification, local queries, and shopping.
    • Trust and privacy are key trade-offs: AI relies on citations, while traditional search shows raw URLs; AI retains conversational context, while traditional allows anonymous browsing.
    • Task-dependent choice is the smart strategy: use AI for quick explanations and comparisons, traditional for official sources and breaking news.

    FAQ

    Q: Is AI search faster than traditional search?
    A: Yes, for simple factual queries or summaries. AI compresses multiple sources into a single answer, while traditional search requires clicking through links. However, for complex or time-sensitive queries, traditional search may be faster because you can directly access the source.

    Q: Can AI search be trusted for accurate information?
    A: It depends. AI is generally reliable for general knowledge, but it can hallucinate on niche topics or recent events. Traditional search, by showing you the actual sources, allows you to verify accuracy yourself. Always cross-check AI answers for health, financial, or legal advice.

    Q: Will traditional search disappear?
    A: No, but it will decline. Gartner predicts a 25% drop in traditional search volume by 2026 as AI chatbots take over more queries. Traditional search will likely remain dominant for transactional and local searches, like buying products or finding store hours.

    Q: Is using AI search private?
    A: Less so than traditional search. Conversational AI retains your query history and context to provide follow-up answers. If privacy is a concern, use incognito mode or a traditional search engine like DuckDuckGo for sensitive queries.

    Q: How can I get the best results from AI search?
    A: Be specific and use natural language. Instead of typing “best laptop,” ask “What is the best budget laptop for video editing in 2025?” You can also refine with follow-up questions like “What about under $800?”—the AI remembers context and adjusts its answers.

  • Norwegian Fjords vs. New Zealand Fjords: Which Is More Dramatic?

    Norway vs. New Zealand: A Tale of Two Natural Wonders

    Imagine standing at the edge of a cliff, looking down a sheer rock face that plunges a thousand meters into dark, silent water. Farther north, you might see snow-capped peaks reflected in a turquoise-blue channel, while in the south, the water is so black it looks like oil, and rain waterfalls streak down every crevice. These are the fjords of Norway and New Zealand—two of the most spectacular glacial landscapes on Earth. But which one is truly more dramatic? The answer depends on what you mean by ‘dramatic’.

    Both regions were carved by the same force: massive glaciers that ground their way through ancient rock over millions of years. Yet the resulting scenery could hardly be more different. Norway offers immense scale and alpine grandeur, with over 1,000 fjords stretching deep into a mountainous interior. New Zealand’s Fiordland counters with raw, wet, rainforest-clad cliffs and a sense of wild isolation that few places can match. In this explainer, we’ll break down the defining features of each—geology, scale, water, and even weather—to help you decide which fjord experience calls to you.

    The Making of a Fjord: Same Sculptor, Different Canvas

    A fjord is formed when a glacier carves a U-shaped valley that extends below sea level, and then the sea floods in after the ice retreats. Norway and New Zealand both owe their fjords to the great ice ages of the past few million years. But the raw materials differed.

    Norway’s fjords cut through some of the oldest rocks on Earth—Precambrian and Caledonian formations up to 2.5 billion years old. These rocks are hard and resistant, but the glaciers were relentless, carving channels that reach depths of over 1,300 meters (4,291 feet) in Sognefjord. The result is a landscape of extreme verticality: cliffs often rise 1,000–1,400 meters straight from the water, and the overall scale is staggering. Norway has more than 1,000 named fjords, the longest being Sognefjord at 204 kilometers (127 miles).

    New Zealand’s Fiordland, on the other hand, is a compact but intense cluster of 14 major fjords on the southwestern tip of the South Island. The bedrock here is younger—granites and gneisses around 300–500 million years old—and the region sits on an active plate boundary. The mountains are still rising at a rate of 5–10 millimeters per year, which means the land is being actively uplifted even as the sea carves into it. This tectonic activity gives Fiordland a raw, jagged feel, but the fjords themselves are shorter and shallower: the longest, Doubtful Sound, stretches only 40 kilometers (25 miles), and its deepest point is 421 meters (1,381 feet).

    Scale and Verticality: Norway’s Overwhelming Grandeur

    If you want sheer volume, Norway wins. Sognefjord is not just the longest fjord in the country—it’s one of the longest in the world, and its depth is almost incomprehensible: 1,308 meters from the surface to the seafloor, deeper than many ocean trenches. The cliffs that flank Geirangerfjord rise to 1,700 meters (5,577 feet) above the water, and the UNESCO-listed Nærøyfjord is a narrow, dramatic corridor where the walls seem to close in on you.

    In New Zealand, the scale is smaller, but don’t mistake that for less impact. Milford Sound’s cliffs reach about 1,200 meters (3,937 feet) straight up, and the fjord is a mere 16 kilometers long. It’s a more intimate, enclosed experience, like being in a stone canyon filled with water. Doubtful Sound is wider and more open, but its very remoteness adds to its drama—you have to take a boat across Lake Manapouri and a bus over a pass to get there.

    Water and Weather: Two Different Personalities

    The water itself tells you which fjord you’re in. Norway’s fjords often show a deep blue-green, and in some areas, glacial silt—fine rock flour—gives the water a milky turquoise tint. This is the classic postcard image: clear, cold, and invitingly bright.

    New Zealand’s fjords are nearly the opposite. The dark, tannin-stained water comes from the native beech forests that blanket the steep slopes. Rain leaches organic compounds into the fjords, turning them a deep brown or black that looks almost like ink. Yet there’s a hidden marvel: in Milford Sound, a layer of fresh water from the heavy rainfall sits on top of the salt water, creating a ‘halocline’ that allows deep-sea creatures like black coral to grow at unusually shallow depths—you can see them from a boat, which is extremely rare anywhere else.

    And the rain is another key difference. Milford Sound receives about 6,700 millimeters (264 inches) of rain per year, making it one of the wettest inhabited places on Earth. This downpour is what creates the hundreds of temporary waterfalls that cascade down the cliffs, turning the fjord into a vertical river. Norway is wet, too, with coastal areas getting up to 3,000 millimeters, but it’s a drier, more alpine atmosphere—more snow than rain above the treeline.

    Human and Cultural Layers: Settled vs. Wild

    Norway’s fjords have been central to human life for thousands of years. Fishing villages dot the shores, stave churches perch on the slopes, and the Hurtigruten coastal steamer has plied these waters since the 1800s. The very word ‘fjord’ is Norwegian, and the landscape is woven into the nation’s identity. Tourism here is mature and highly organized: the ‘Norway in a Nutshell’ tour is a classic day trip, and Geirangerfjord alone welcomes over 300,000 cruise passengers each year.

    New Zealand’s Fiordland is a different story. Māori used the area for seasonal hunting and gathering, especially of pounamu (greenstone), but they didn’t settle permanently. Captain Cook arrived in the 1770s and famously doubted whether Doubtful Sound could be navigated. Even today, the region feels wild and untamed. Milford Sound is accessible by road and gets up to a million visitors a year, but Doubtful Sound sees only about 40,000—a fraction of the crowds, and the only way in is a two-part journey across a lake and a mountain pass. The difference is palpable: in Norway, you’re often sharing the fjord with cruise ships; in Fiordland, you can feel like you have the place to yourself.

    The Verdict: Depends on Your Definition of Drama

    So which is more dramatic? It’s a tie, but in different ways. Norway offers the drama of superlatives: longer, deeper, taller, and more numerous. The scale is so vast that it can feel overwhelming, almost impersonal. The cliffs are sheer, the water is deep blue, and the mountains are snow-capped even in summer. It’s the drama of pure size and grandeur.

    New Zealand’s drama is more about mood and motion. The rainforest-clad cliffs, the near-constant rain, the dark water, and the temporary waterfalls give it a sense of raw, living power. The fact that the mountains are still rising means the landscape is literally being shaped as you watch. It’s the drama of wildness and unpredictability.

    If you want to feel small against an enormous backdrop, head to Norway. If you want to feel like you’re in a prehistoric, untamed world, go to Fiordland. Both are masterpieces of glacial artistry—just with different palettes and scales.

    In the end, the question of which fjords are more dramatic is a matter of taste. Norway’s fjords are the grand cathedrals of nature—vast, towering, and awe-inspiring in their sheer dimensions. New Zealand’s fjords are the wild forests of the sea—wet, dark, and alive with the sense of ongoing creation. Whether you prefer the epic scale of Sognefjord or the intimate intensity of Milford Sound, both destinations deliver a spectacle that stays with you long after you leave. The real drama is in the journey—and in the way each fjord makes you feel.

    Summary

    • Norway has over 1,000 fjords, with the longest (Sognefjord) stretching 204 km and the deepest (also Sognefjord) plunging 1,308 m.
    • New Zealand has 14 major fjords in Fiordland, with Doubtful Sound the longest at 40 km and the deepest at 421 m.
    • Cliffs in Norway can rise 1,700 m above the water; in New Zealand, Milford Sound’s cliffs reach about 1,200 m.
    • Water color differs: Norway’s is often blue-green with glacial silt, while Fiordland’s is dark, tannin-stained, and can hide black coral at shallow depths.
    • Rainfall sets them apart: Milford Sound gets ~6,700 mm/year, creating temporary waterfalls, while Norway’s wettest areas get ~3,000 mm.
    • Norway’s fjords are deeply settled and tourist-friendly, with a mature infrastructure; New Zealand’s Fiordland is wilder, with remote Doubtful Sound seeing only ~40,000 visitors a year.

    FAQ

    Q: Which fjords are longer, Norway’s or New Zealand’s?
    A: Norway’s fjords are significantly longer. The longest is Sognefjord at 204 km, while New Zealand’s longest, Doubtful Sound, is only 40 km.

    Q: Are the fjords in New Zealand actually called sounds?
    A: Yes, locals often call them ‘sounds’, but that’s a misnomer—they are true fjords, carved by glaciers, not river valleys drowned by the sea.

    Q: Why is Milford Sound’s water so dark?
    A: The water is stained dark brown or black by tannins from the surrounding native beech forest. Rain leaches organic compounds into the fjord.

    Q: Can you see black coral in Milford Sound?
    A: Yes, unusually shallow depths. The freshwater layer from heavy rain creates a halocline that allows deep-sea organisms like black coral to thrive at depths of just a few meters.

    Q: Which is easier to visit, Norwegian fjords or Fiordland?
    A: Norway has more extensive infrastructure, with roads, tunnels, ferries, and the famous Flåm Railway. Fiordland’s Milford Sound is also accessible by road, but Doubtful Sound requires a boat transfer across Lake Manapouri and a bus over a pass.

  • Lisbon vs. Porto: A Tale of Two Portuguese Coastal Cities

    Porto vs Lisbon: my honest take on Portugal's two most popular cities

    Portugal packs a lot into a small country, and its two biggest cities offer a study in contrasts. Lisbon, the sun-soaked capital, lures millions with its iconic trams and hilltop views. Porto, the northern powerhouse, counters with a gritty charm, a UNESCO-listed historic center, and a fierce independent streak. This isn’t just a friendly rivalry; it’s a centuries-old clash of identity, economics, and culture, all playing out along the Atlantic coast.

    Whether you’re planning a visit, considering a move, or just curious about what makes each tick, understanding the real differences between Lisbon and Porto goes beyond surface impressions. Here’s what the data and history actually show.

    The Roots of the Rivalry

    Lisbon became the capital in 1255, but Porto’s roots go deeper. The city’s Roman name, Portus Cale, is where “Portugal” comes from — a point Porto fans love to make. The rivalry hardened during the 19th-century Liberal Wars, when Porto withstood a long siege and earned the nickname “Invicta” (the Unvanquished). Lisbon, by contrast, was tied to the absolutist side. That history forged a northern identity built on resilience and hard work, set against a southern seat of political power.

    The 20th century only widened the gap. Under the Estado Novo dictatorship (1933–1974), Lisbon centralized political and economic power, while Porto’s industrial base was often overlooked in infrastructure investment. That grievance still echoes in local media and barroom debates.

    Economic Divergence: Two Paths to Growth

    The economic story since 2008 has been one of divergence and convergence. Lisbon boomed first, pulling in foreign investment, tourism, and tech. The Web Summit moved there in 2016, and startups like Farfetch and OutSystems put the capital on the map as a southern European tech hub. Porto took longer to recover from austerity but has since built a niche in software engineering and creative industries, with companies like Blip and Critical Software.

    Today, Lisbon’s metropolitan area is home to roughly 2.8 million people — about 27% of Portugal’s population — while Porto’s metro is a distant second at 1.7 million. That concentration of people and capital makes Lisbon the clear economic engine, but Porto’s growth rate has been catching up.

    Real estate tells the same story. A one-bedroom in Lisbon’s center averages €1,200–1,600 per month; in Porto, it’s €800–1,100. Both cities face housing crises driven by tourism and foreign buyers, but Lisbon’s prices are steeper, fueled by its global profile.

    The Tourist Experience: Crowds vs. Charm

    Lisbon dominates on visitor numbers, drawing 5–6 million overnight stays annually versus Porto’s 2–3 million. That gap is visible in the streets: Lisbon’s historic trams are packed, Belém Tower queues stretch, and the Alfama district hums with crowds. Porto’s narrower lanes feel less overwhelmed, though its famous spots — the Clérigos Tower, Livraria Lello, São Bento Station — draw their own lines.

    What each city offers differs in flavor. Lisbon is a hill-climbing adventure with miradouros (viewpoints) at every turn, plus the UNESCO-listed Belém complex and the 25 de Abril Bridge. Porto’s historic center, also UNESCO-listed, hugs a steep river gorge, with the Dom Luís I Bridge spanning the Douro. Across the river in Vila Nova de Gaia, the Port wine lodges offer tastings with a view — a ritual Lisbon can’t match.

    Climate: Sun vs. Rain

    If you’re chasing sunshine, Lisbon wins. It averages around 2,800 hours of sun per year, with warm, dry summers (August highs around 28°C) and mild winters. Porto is cooler and rainier, getting roughly 1,250 mm of annual rainfall compared to Lisbon’s 750 mm. Summers in Porto are warm but less extreme. The trade-off: Porto’s lush green surroundings and dramatic river mists give it a distinct, moody atmosphere that many find more photogenic.

    Culture: Fado vs. Francesinha

    Lisbon’s culture is cosmopolitan and melancholic, steeped in Fado music (UNESCO-listed) and a slower rhythm. Pastéis de nata are the snack of choice, and the city exudes a nostalgia for its imperial past.

    Porto’s identity is grittier and more direct. Locals proudly call themselves “tripeiros” (tripe-eaters), a nickname from the 15th century when they gave their meat to feed explorers’ ships and kept only tripe. The signature dish is the francesinha — a calorie-dense sandwich layered with ham, sausage, steak, and melted cheese, drowned in a beer-based sauce. It’s a testament to the city’s no-nonsense, hardworking ethos.

    The Underdog Narrative: Why Porto’s Pride Runs Deep

    For Porto, the rivalry isn’t just about football (FC Porto vs. Benfica and Sporting CP). It’s a persistent sense of being the overlooked industrial engine, the city that builds while Lisbon administers. This narrative fuels local media commentary, jokes about Lisbon’s “parasite” status, and a fierce defensiveness of Porto’s authenticity.

    Lisbon, for its part, often views Porto as a charming provincial cousin. That dismissiveness only sharpens Porto’s edge. Visitors often notice the difference in attitude: in Porto, you’re more likely to get a straight answer; in Lisbon, a more polished, diplomatic one.

    Which City Should You Choose?

    If you want a fast-paced, internationally connected city with more job opportunities, a bigger airport (Humberto Delgado), and a warmer climate, Lisbon is the practical choice. If you prefer a more compact, characterful city with lower costs, a stronger sense of community, and a rainier but more dramatic setting, Porto rewards with a distinct charm.

    Both cities offer excellent food, rich history, and access to the Atlantic. But they deliver very different experiences. Lisbon is the grand, sunlit stage; Porto is the gritty, proud understudy stealing scenes.

    The Future: Rivalry or Balance?

    Neither city is stagnant. Lisbon grapples with overtourism and rising costs, pushing some visitors and residents toward alternatives. Porto, meanwhile, has embraced tech and tourism, and its airport (Francisco Sá Carneiro) is expanding. The rivalry will likely persist, but it’s becoming less binary: each city is learning from the other’s playbook. For Portugal as a whole, that competition is a healthy tension — two coastal cities, each with a distinct pulse, together defining a nation’s identity.

    Lisbon and Porto embody two sides of Portugal: the capital’s global ambition and the north’s resilient pride. Neither is objectively better — they’re just different, shaped by history, geography, and economics. Whether you’re drawn to Lisbon’s sunlit hills or Porto’s river gorge, you’ll find a city with a story worth exploring. And if you can’t choose, the good news is they’re only a three-hour train ride apart.

    Summary

    • Population: Lisbon metro (2.8M) is nearly double Porto’s (1.7M), reflecting its role as the political and economic center.
    • Costs: Rents and salaries are higher in Lisbon; Porto offers more affordable living, though both face housing pressure from tourism.
    • Climate: Lisbon gets more sun and less rain; Porto is cooler and wetter, with a more dramatic landscape.
    • Culture: Lisbon is cosmopolitan and Fado-driven; Porto is gritty and proud, with a distinct culinary identity like the francesinha.
    • Tourism: Lisbon draws 5–6M visitors annually vs. Porto’s 2–3M, leading to more crowds but also more infrastructure.

    FAQ

    Q: Is Lisbon or Porto better for tourists?
    A: It depends on your preference. Lisbon offers more attractions and a bigger airport, but Porto provides a more compact, less crowded experience. If you want sunshine and iconic landmarks, choose Lisbon; if you prefer charm and wine cellars, choose Porto.

    Q: Which city is more affordable to live in?
    A: Porto is cheaper, with average rents for a one-bedroom in the center around €800–1,100, versus €1,200–1,600 in Lisbon. Salaries are slightly lower in Porto, but the cost-of-living gap makes it more budget-friendly.

    Q: What’s the historical reason for the rivalry?
    A: The rivalry dates back to the 19th-century Liberal Wars, when Porto’s siege earned it the title “Invicta,” and Lisbon was associated with the absolutist side. This created a lasting northern identity of resilience versus southern political power.

    Q: Is Porto a UNESCO World Heritage Site?
    A: Yes, Porto’s historic center has been a UNESCO World Heritage Site since 1996, while Lisbon has the Belém area with the tower and monastery as a designated site.

    Q: Which city has the better football teams?
    A: Both have top-tier clubs: Lisbon has Benfica and Sporting CP, while Porto has FC Porto and Boavista. The matches between Benfica and Porto are among the most intense in Portuguese football.

  • Prague vs. Budapest: Which Fairytale City Should You Visit?

    Prague vs Budapest. Which City Should You Visit in 2026?

    Two Central European capitals, both draped in spires and cobblestones, both calling themselves fairytale cities. Prague is the City of a Hundred Spires, a medieval dream preserved in amber. Budapest is the Pearl of the Danube, a grand imperial stage set on a mighty river. If you’re planning a trip and can’t choose between them, you’re not alone. They share a Habsburg past, a communist hangover, and an uncanny ability to make you feel like you’ve stepped into a storybook.

    But they are not the same story. Prague is a compact, intimate fantasy of Gothic lanes and Baroque squares. Budapest is a sprawling, dramatic saga of thermal baths, ruin bars, and river-spanning grandeur. Your choice depends on what kind of fairytale you want to live in. Let’s break down the differences so you can pick your own adventure.

    The Fairytale Factor: Medieval Charm vs. Imperial Grandeur

    Prague’s fairytale reputation rests on its astonishingly intact medieval core. The city survived World War II with minimal damage, so its Old Town is a dense labyrinth of Gothic churches, Renaissance palaces, and crooked alleyways. The Astronomical Clock, ticking since 1410, draws crowds every hour. Charles Bridge, lined with Baroque saints, connects the Old Town to the castle district, where Prague Castle—the largest ancient castle complex in the world, according to Guinness—looms over the Vltava. It’s a storybook setting that filmmakers have used for decades.

    Budapest’s fairytale is different. It’s not about medieval intimacy but about imperial sweep. The Hungarian Parliament Building, an ornate Neo-Gothic masterpiece on the Danube, is one of the largest parliament buildings on Earth. Buda Castle and the Fisherman’s Bastion offer panoramic views across the river, their white stone and turrets glowing at sunset. And the Chain Bridge, the first permanent bridge across the Danube, adds a touch of 19th-century romance. This is a fairytale written on a grand scale, with a river as the central character.

    A Tale of Two Histories: Why Prague Feels Older

    History explains the different textures of these cities. Prague was a Habsburg seat and a major European capital under Charles IV in the 14th century, but it was never conquered by the Ottomans. Its medieval fabric remained largely untouched until the 20th century. The Nazis occupied it, but the city was spared the kind of aerial bombardment that flattened Warsaw or Dresden. As a result, Prague’s core is a time capsule.

    Budapest, by contrast, endured 145 years of Ottoman rule (1541–1686) and then suffered catastrophic damage in World War II. The Siege of Budapest in 1944–45 destroyed much of the city, and the 1956 Revolution added more scars. Rebuilding was often hasty and sometimes brutalist, so Budapest’s streets mix grand Habsburg boulevards with socialist-era concrete. This layering gives the city a grittier, more complex character. It’s less pristine than Prague, but arguably more real.

    The Spas vs. The Beer

    Budapest is the undisputed thermal bath capital of Europe. With more than 120 thermal springs, it’s called the “City of Spas.” The Széchenyi Thermal Bath, housed in a sprawling yellow Neo-Baroque palace, is the largest medicinal bath in Europe—a perfect place to soak under the stars after a day of sightseeing. Gellért Baths, with their Art Nouveau interiors, are another icon. This is a fairytale you can bathe in.

    Prague’s claim to liquid fame is beer. The Czech Republic consumes more beer per capita than any other country, and Prague’s pubs serve legendary brews like Pilsner Urquell and Budvar. In many pubs, beer is cheaper than bottled water. The city’s pub culture is deep and unpretentious—a contrast to Budapest’s more theatrical ruin bars. These are not just bars but sprawling complexes in abandoned buildings, filled with mismatched furniture and eclectic art. Szimpla Kert, the original ruin bar, is a maze of rooms and courtyards that feels like a psychedelic fairytale of its own.

    The Practicalities: Cost, Size, and Getting Around

    Budapest generally wins on cost. Accommodation, dining, and attractions are slightly cheaper than in Prague, which has seen prices climb as its popularity has soared. Both cities use their own currencies—Czech koruna and Hungarian forint—and neither uses the euro, so budgeting requires a bit of math.

    Prague is more compact and walkable. You can cross the Charles Bridge and wander from Old Town to the castle in a day. Budapest is larger and more spread out, but its public transport is excellent—four metro lines, trams, and a funicular up to the castle. You’ll need more than two or three days to see Budapest properly. If you only have a weekend, Prague is the easier choice.

    Nightlife and Culture: Different Flavors

    Prague’s nightlife is centered on beer halls and clubs, though some areas are overrun with stag parties. For a more refined evening, catch a classical concert in a Baroque church or visit the Kafka Museum. Czech culture is often described as reserved and secular—the country is among the most atheist in Europe—but its literary and musical heritage is rich, from Mozart to Václav Havel.

    Budapest’s nightlife is more flamboyant. The ruin bars are a central attraction, but there are also rooftop bars, ruin pubs, and ruin nightclubs. Hungarian culture is more expressive, with a unique language that’s unrelated to any other European tongue, and a cuisine that’s bold with paprika. A visit to the Great Market Hall is a feast for the senses, with stalls selling paprika, sausages, and handmade embroidery.

    Which City Should You Choose?

    If you want a storybook medieval town where you can walk everywhere and feel like you’ve stepped into a Brothers Grimm illustration, choose Prague. Its spires, cobblestones, and castle will deliver that fairytale feeling in abundance.

    If you want grandeur, a dramatic river, thermal baths, and a more layered, lively urban experience, choose Budapest. It’s a fairytale with more grit, more history, and more to do—especially if you love soaking in hot water at sunset.

    And if you have the time, don’t choose. The two cities are connected by a scenic train ride or a short flight. They’re close enough to combine into one epic Central European adventure. After all, you can never have too many fairytales.

    Prague and Budapest both deliver fairytale charm, but they spin different kinds of magic. Prague is a preserved medieval dream, compact and storybook-perfect. Budapest is a grand imperial spectacle, bathed in thermal waters and layered with history. Your choice depends on whether you prefer your castles on a hill or your parliament on a river. But either way, you’ll wander streets that feel like they belong in a story—and you’ll leave with memories that feel just as enchanted.

    Summary

    • Prague is more compact and walkable, with a fully intact medieval center that feels like a storybook.
    • Budapest is larger and more dramatic, with grand boulevards, a mighty river, and Europe’s largest thermal bath.
    • Budapest is generally cheaper for food, drinks, and accommodation.
    • Prague wins on beer culture and medieval atmosphere; Budapest wins on thermal baths and ruin bars.
    • Budapest has a more layered, gritty history, while Prague felt untouched by war—making it look more ‘fairytale’.
    • If you have time, visit both—they’re close enough to combine into one trip.

    FAQ

    Q: Which city is cheaper: Prague or Budapest?
    A: Budapest is generally cheaper for accommodation, dining, and attractions, though prices in Prague have risen in recent years. Both use their own currencies (Czech koruna and Hungarian forint), not the euro.

    Q: Which city is better for a short trip?
    A: Prague is more compact and walkable, making it ideal for a weekend getaway. Budapest is larger and requires more time to explore, but has excellent public transport.

    Q: Which city has better thermal baths?
    A: Budapest is the clear winner, with over 120 thermal springs and iconic baths like Széchenyi and Gellért. Prague has fewer and less famous options.

    Q: Are these cities safe for tourists?
    A: Both Prague and Budapest are generally safe, but watch out for pickpockets in crowded tourist areas and be aware of your surroundings at night.

    Q: What’s the best time to visit?
    A: Spring (April–June) and fall (September–October) offer pleasant weather and fewer crowds. Summers can be hot and busy, while winters are magical with Christmas markets.

  • Barcelona vs. Madrid: The Ultimate Spanish Showdown

    Barcelona vs Madrid: A tale of two vibrant cities! 😍🫶🇪🇸 💡It's the ultimate showdown: Barcelona versus Madrid. These two Spanish powerhouses each possess their own unique charm and allure. Barcelona, with its

    Two cities. One country. A rivalry that spans centuries, football pitches, and political divides. Barcelona and Madrid are more than just Spain’s two largest metropolises; they embody competing visions of what Spain is and should be. One is a Mediterranean port with a distinct language and a fierce independent streak; the other is a high-altitude capital that has long been the seat of centralized power. Their competition shapes everything from tourism and tech to the very identity of the nation.

    This isn’t just about which city has better tapas or cooler architecture—though those debates are real. It’s about economics, history, and a cultural clash that plays out in stadiums, boardrooms, and ballot boxes. Let’s break down the showdown.

    Geography: Center vs. Coast

    Madrid sits at 650 meters above sea level, making it one of Europe’s highest capitals. It’s the geographic heart of the Iberian Peninsula, a landlocked hub that has been Spain’s political center since 1561. Barcelona, by contrast, hugs the northeastern Mediterranean coast, the capital of Catalonia, a region with its own language and legal traditions that date back to the medieval Crown of Aragon.

    Their metro areas differ in size: Madrid’s population is about 6.7 million, while Barcelona’s is 5.6 million. Both rank among the EU’s largest cities—Madrid at #2, Barcelona at #6. But the real difference lies in their orientation: Madrid looks inward, to the rest of Spain and Latin America; Barcelona looks outward, across the sea to Europe and beyond.

    Economy: Finance vs. Industry

    Madrid is Spain’s financial and administrative engine. It hosts the IBEX 35 stock exchange, the headquarters of banking giants like Santander and BBVA, and the Spanish offices of most multinationals. Its metro GDP was around €261 billion in 2022, making it the wealthier of the two. The city has positioned itself as the “gateway to Latin America” for European firms, leveraging its language and time zone advantages.

    Barcelona, meanwhile, is the industrial and trade powerhouse. Its port is a major Mediterranean shipping hub, and it leads in textiles, chemicals, and pharmaceuticals. More recently, it’s become a tech and startup hotspot—home to the Mobile World Congress and a growing innovation ecosystem. Its metro GDP was about €178 billion in 2022, smaller than Madrid’s but with a different flavor: manufacturing and commerce over finance and services.

    Both cities rank in Europe’s top 10 startup ecosystems, but they’ve taken different paths. Madrid’s economy is more diversified across services, while Barcelona’s is more reliant on tourism and trade, leaving it more exposed to fluctuations in those sectors.

    Tourism: Beaches vs. Culture

    Barcelona has long been Spain’s tourism magnet. Pre-pandemic, it welcomed over 12 million international visitors annually, drawn by its beaches, Gaudí’s surreal architecture, and Mediterranean charm. Madrid, by contrast, attracted around 7-8 million, but it’s been catching up fast. The capital’s appeal lies in its world-class museums—the Prado, Reina Sofía, and Thyssen-Bornemisza form the “Golden Triangle of Art”—plus its gastronomy and luxury shopping.

    Both cities face challenges from tourism. Barcelona grapples with overtourism, which has fueled housing affordability crises and anti-tourist sentiment. Madrid’s growth has been steadier, but it too is feeling the pressure of rising visitor numbers.

    Sports: The Global Stage

    The rivalry reaches its most visible peak in sports. Real Madrid CF and FC Barcelona are two of the most successful football clubs on Earth, and their meetings—”El Clásico”—draw an estimated 400 million viewers each. As of 2024, Real Madrid leads the all-time head-to-head with about 104 wins to Barcelona’s 100, with 63 draws. The matches are more than just football; they’re a proxy for the political and cultural tensions between the central state and Catalonia.

    Basketball adds another layer. Real Madrid Baloncesto and FC Barcelona Basket are both EuroLeague powerhouses, regularly competing for titles. The sporting rivalry extends beyond the pitch and the court, fueling a passionate fan culture that permeates daily life in both cities.

    History: From Siege to Sovereignty

    The roots of the rivalry run deep. Madrid became the capital in 1561 under Philip II, centralizing power in a way that has defined Spanish politics ever since. Barcelona, as the capital of Catalonia, maintained a distinct identity through the medieval Crown of Aragon, with its own language and legal codes.

    The Spanish Civil War (1936-1939) hardened the divide. Barcelona was a Republican stronghold, while Madrid endured a brutal siege. When Francisco Franco won, he suppressed Catalan language and identity, favoring Madrid with investment and infrastructure. This favoritism deepened resentment in Catalonia, which saw its industrial base neglected even as it was politically marginalized.

    The transition to democracy in 1978 created Spain as a “state of autonomies,” granting Catalonia significant self-governance. But the framework remains contested. The 1992 Barcelona Olympics were a turning point, transforming the city into a global destination and a model of urban regeneration. Madrid, meanwhile, invested heavily in infrastructure in the 2000s and 2010s, including high-speed rail and airport expansion, solidifying its status as a business hub.

    The 2017 Catalan independence referendum and subsequent political crisis created a deep rift between Catalonia and the central government. Many companies moved their headquarters from Barcelona to Madrid in response to the instability, a blow to Barcelona’s status as an economic center.

    Culture: Language, Architecture, and Lifestyle

    Language is a flashpoint. Catalan is co-official in Barcelona and spoken by about 9 million people, while Madrid is monolingual in Spanish (Castilian). Language policy in Catalonia, especially in schools, has been a source of ongoing conflict with the central government.

    Architecture tells a different story. Barcelona is synonymous with Modernisme, the Catalan art nouveau movement epitomized by Antoni Gaudí’s Sagrada Família, Park Güell, and Casa Batlló. Madrid offers a blend of Habsburg and Bourbon classicism—the Royal Palace, Plaza Mayor—plus modern skyscrapers like the four towers of the business district.

    Lifestyle also diverges. Madrid is famous for its late nights: dinner at 10 PM, clubs until 6 AM, and a traditional “castizo” culture rooted in flamenco, churros, and the bustling Plaza Mayor. Barcelona is more Mediterranean—beach days, tapas by the sea, and an international, bohemian vibe in neighborhoods like El Born and Gràcia. Barcelona’s urban fabric, with its grid-like Eixample and pedestrian-friendly streets, encourages a different pace of life.

    The Political Divide: Center vs. Periphery

    Politically, Madrid often sees itself as the defender of Spanish unity and the constitution. It’s the seat of government, the monarchy, and the parliament. Barcelona, as the capital of Catalonia, has become the epicenter of a pro-independence movement that has grown over the past decade. The 2017 referendum, which was declared illegal by the central government, led to a crackdown and the exile of several Catalan leaders. This has intensified the symbolic weight of the rivalry: every El Clásico is watched not just for the football, but for the political undertones.

    The economic implications are significant. Madrid’s model is centralized services, finance, and logistics, benefiting from its status as the capital. Barcelona’s is manufacturing, trade, and innovation, but it’s vulnerable to political instability, as seen in the corporate relocations after 2017.

    Which City Is Better?

    There’s no objective answer, but the choice often comes down to what you value. Madrid offers career opportunities in finance and government, a rich arts scene, and a vibrant nightlife that runs into the early hours. Barcelona offers a coastal lifestyle, world-class architecture, and a more laid-back, international atmosphere. It’s also more compact and walkable, with easier access to the sea and mountains.

    For businesses, Madrid’s central location and political stability make it a safer bet for headquarters. Barcelona’s innovation ecosystem and quality of life attract startups and creatives, but its political uncertainty is a risk. For tourists, Barcelona’s beaches and Gaudí draw bigger crowds, but Madrid’s museums and authentic Spain vibe are increasingly popular.

    Ultimately, the rivalry is part of what makes Spain fascinating. It’s a living, breathing competition that shapes the country’s identity—and it’s unlikely to be resolved anytime soon.

    Barcelona and Madrid are two titans of Spain, each with its own strengths, histories, and visions for the future. Whether you’re cheering for Real Madrid or FC Barcelona, strolling through the Prado or marveling at the Sagrada Família, you’re experiencing a rivalry that transcends sports and tourism. It’s a clash of centralization and regional identity, finance and industry, tradition and innovation. And that’s what makes the ultimate Spanish showdown so compelling.

    Summary

    • Geography: Madrid is a high-altitude capital in the center; Barcelona is a coastal Mediterranean city.
    • Economy: Madrid leads in finance and services (GDP €261B); Barcelona excels in industry, trade, and tech (GDP €178B).
    • Tourism: Barcelona attracts more international visitors (12M+ vs. 7-8M), but Madrid is growing faster.
    • Sports: El Clásico is the world’s most-watched club match, with Real Madrid leading the all-time series.
    • Politics: The Catalan independence movement has deepened the rivalry, with implications for business and governance.

    FAQ

    Q: Which city is larger, Barcelona or Madrid?
    A: Madrid is larger in terms of metro area population (about 6.7 million vs. Barcelona’s 5.6 million).

    Q: What is El Clásico?
    A: It’s the football match between Real Madrid and FC Barcelona, two of the most successful clubs in the world. It’s considered the most-watched club match globally, with over 400 million viewers.

    Q: Why do Barcelona and Madrid have such a strong rivalry?
    A: The rivalry stems from political and cultural differences. Madrid has been the central seat of Spanish power since 1561, while Barcelona is the capital of Catalonia, a region with its own language and identity. Historical events like the Spanish Civil War and the Franco era deepened the divide, and the recent independence movement has kept it alive.

    Q: Which city is better for tourists?
    A: It depends on your preferences. Barcelona offers beaches, Gaudí’s architecture, and a Mediterranean vibe. Madrid offers world-class museums (Prado, Reina Sofía), royal palaces, and a vibrant nightlife. Barcelona sees more tourists, but Madrid is catching up.

    Q: Has the Catalan independence movement affected businesses?
    A: Yes, after the 2017 referendum and political crisis, many companies moved their headquarters from Barcelona to Madrid for stability. This has had a short-term economic impact on Barcelona, though it remains a major economic hub.

  • Tokyo vs. Seoul: Which Asian Metropolis Is More Futuristic?

    Tokyo vs Seoul: Which City Should You Visit First? - Lokafy

    Tokyo and Seoul are often seen as the twin peaks of Asian futurism. Tokyo dazzles with bullet trains and robot-staffed hotels; Seoul counters with the world’s fastest internet and a government that runs on AI. But which city truly deserves the title of ‘most futuristic’? The answer depends on how you define the future—whether it’s gleaming infrastructure or seamless digital integration.

    Two Visions of the Future

    Tokyo’s futurism is rooted in the post-war economic miracle. The 1964 Olympics introduced the Shinkansen, and the 1980s cyberpunk aesthetic of Akira and Blade Runner drew from its neon-drenched streets. But after decades of economic stagnation, much of Tokyo’s infrastructure is aging, and the city often feels like a high-tech museum—impressive, but retrofitted rather than built anew.

    Seoul, by contrast, surged ahead during the digital boom of the 2000s. The “Miracle on the Han River” transformed a war-torn nation into a tech powerhouse, with Samsung, LG, and Hyundai driving aggressive innovation. Today, Seoul’s futurism is less about physical spectacle and more about invisible, ubiquitous connectivity.

    Physical Infrastructure: Tokyo’s Bullet Trains and Robots

    Tokyo’s physical futurism is hard to beat. The Shinkansen network, operational since 1964, carries millions at speeds up to 285 km/h, with maglev prototypes hitting 603 km/h. The city’s transit system moves about 20 million passengers daily through hyper-dense, automated stations. Vending machines—around 5 million nationwide—dispense everything from drinks to umbrellas.

    Robots are another Tokyo hallmark. Honda’s ASIMO may have retired in 2018, but SoftBank’s Pepper still greets customers, and the Henn-na Hotel briefly operated with a robot staff before partially de-robotizing in 2019. Toyota’s Woven City, a smart city under construction near Mt. Fuji, aims to house 2,000 residents in a living laboratory of autonomous vehicles and AI.

    Yet Tokyo’s analog habits persist. Bureaucracy still relies on fax machines and hanko seals, and cash remains common. The city’s digital government is behind Seoul’s, despite a national ID card system.

    Digital Services: Seoul’s Connected City

    Seoul’s futurism is digital-first. It consistently ranks among the top three globally for average internet speeds, with 5G coverage among the densest in the world. Ninety-eight percent of households have broadband, and smartphone penetration is around 95%.

    Smart city leadership is a point of pride. Seoul won the Smart City Expo World Congress award in 2022 and 2023, and its “Smart Seoul 2030” plan integrates AI, IoT, and big data into public services. The UN ranks South Korea first in e-government development, and citizens can handle nearly all bureaucratic tasks online—from taxes to address changes—without stepping into an office.

    Seoul’s transportation is also smart. The T-money contactless card has been in use since 2004, and real-time bus apps are ubiquitous. Over 90% of buses and taxis are connected with live data. The GTX high-speed subway lines, opening in 2024–2025, aim for average speeds above 100 km/h, linking the capital area more efficiently.

    Demographics: Necessity vs. Desire

    Aging shapes Tokyo’s future. Nearly 29% of Japan’s population is over 65, driving demand for care robots and automated services. Tokyo’s futurism is a response to necessity—how to maintain a high quality of life with fewer workers.

    Seoul faces a low birth rate too, but its demographic is younger and more tech-savvy. The city’s futurism is consumer-driven: people demand faster internet, seamless payments, and AI-powered conveniences like the “Digital Mayor,” an AI avatar launched in 2023 to answer citizen queries 24/7.

    The Verdict: Which Is More Futuristic?

    If futurism means gleaming infrastructure and robots, Tokyo wins. If it means digital integration and e-government, Seoul takes the lead. Tokyo’s future is physical, visible, and aesthetic—a city of bullet trains and humanoid machines. Seoul’s future is digital, invisible, and service-oriented—a city where government and daily life are encoded into apps and data.

    Neither city fully embodies a sci-fi ideal. Tokyo still uses faxes; Seoul’s streets aren’t filled with robots. But each offers a distinct glimpse of what’s to come—one built with steel and silicon, the other with code and connectivity.

    Tokyo and Seoul represent two compelling blueprints for the future. Tokyo’s futurism is tangible—high-speed trains, robots, and a cityscape that feels like a cyberpunk film set. Seoul’s is intangible—lightning-fast networks, AI-driven governance, and a fully connected citizenry. Neither is definitively “more” futuristic; they simply future differently. As both cities evolve, they’ll likely borrow from each other, creating a hybrid future that’s both physical and digital.

    Summary

    • Tokyo excels in physical futurism: bullet trains, robots, and vast infrastructure, but lags in digital bureaucracy.
    • Seoul leads in digital futurism: fastest internet, smart city awards, and top-ranked e-government.
    • Demographics drive the difference: Tokyo innovates out of necessity (aging population), Seoul out of consumer demand.
    • The verdict depends on your definition: infrastructure vs. connectivity.
    • Both cities offer unique visions of tomorrow, blending high-tech with cultural quirks.

    FAQ

    Q: Which city has better public transportation for the future?
    A: Tokyo’s Shinkansen and automated subways are world-class, but Seoul’s GTX lines and real-time data integration are rapidly modernizing its transit. Tokyo’s system is more extensive; Seoul’s is more digitally integrated.

    Q: Is Seoul really more digital than Tokyo?
    A: Yes, in terms of government services and internet speed. Seoul ranks #1 in UN e-government and has faster average broadband. Tokyo still relies on faxes and cash in many areas.

    Q: What about robots?
    A: Tokyo has more robots in public life, from Pepper to robot hotels. Seoul is catching up with AI-based services like the Digital Mayor, but physical robots are less visible.

    Q: Which city is better for tech startups?
    A: Seoul has a more supportive ecosystem for digital startups, with strong government backing and a tech-savvy population. Tokyo offers a larger market but has a more conservative corporate culture.

    Q: Will these cities converge in the future?
    A: Likely. Tokyo is adopting more digital services, and Seoul is investing in physical infrastructure. Both are incorporating AI and IoT, so the gap may narrow.

  • Why Do We Compare Ourselves to Strangers on Social Media?

    Why Do We Compare Ourselves to Strangers on Social Media?

    It’s 11 p.m. and you’re scrolling through Instagram. A stranger—someone you’ve never met—is posting from a beach in Bali, laughing with a cocktail in hand. You feel a pang of something. It’s not quite jealousy, not quite admiration, but it’s uncomfortable. You close the app, but the feeling lingers. Why does a stranger’s highlight reel affect you so much?

    This scenario is universal. Social media has turned comparison into a 24/7 habit, and psychologists have been studying it for decades. The roots go back to 1954, when psychologist Leon Festinger proposed social comparison theory: humans have an innate drive to evaluate themselves by comparing to others, especially when objective measures are missing. But social media has supercharged this ancient instinct, and the consequences are real—from envy to depression.

    In this article, we’ll unpack the psychology, neuroscience, and sociology behind why we compare ourselves to strangers online. You’ll learn why your brain treats a stranger’s vacation photo like a threat, how algorithms amplify the effect, and what you can do to break the cycle.

    The Ancient Roots of Comparison

    Imagine you’re a hunter-gatherer 50,000 years ago. Your survival depends on your standing in a tribe of maybe 50 people. If you’re stronger, faster, or more skilled, you get better food, a mate, and protection. Your brain evolved a “social monitoring system” to constantly check where you rank. This was a survival tool.

    Fast forward to today. Your tribe is now the 300 people you follow on Instagram, plus the millions of strangers on TikTok. But your brain doesn’t know the difference. It still thinks social standing equals survival. So when you see a stranger’s luxury car or perfect body, your brain registers it as a threat to your position—even though you’ll never compete with that person for resources.

    This mismatch is at the heart of the problem. Your brain is wired for a small village, not a global feed. As psychologist Leon Festinger noted in 1954, we compare ourselves when objective standards are unavailable. On social media, objective standards are everywhere—follower counts, likes, engagement—but they’re misleading. They measure popularity, not worth.

    Upward and Downward: The Two Types of Comparison

    Psychologists distinguish between two types of comparison, and social media is dominated by one.

    Upward comparison is when you compare yourself to someone you perceive as better off. This can be inspiring—like seeing a fitness influencer and feeling motivated to hit the gym. But it can also be deflating, especially when the gap feels unbridgeable. A 2018 study in Computers in Human Behavior found that passive scrolling (just browsing, not interacting) is strongly linked to upward comparison, which in turn predicts envy and depressive symptoms.

    Downward comparison is the opposite—comparing yourself to someone worse off. This can boost self-esteem (“At least I’m not that guy”), but it also breeds complacency. Social media offers plenty of downward targets too, like memes about failed relationships or cringe-worthy videos. But here’s the catch: downward comparison is less common on social media because people rarely post their failures. The feed is skewed upward.

    The result? You’re constantly swimming in upward targets, and your brain’s comparison engine runs in overdrive.

    The Curated Self and the Stranger Problem

    Why is comparing to a stranger so different from comparing to a coworker? Three reasons stand out.

    First, you lack context. When you compare to a coworker, you know their struggles—they’ve been stressed about their kid, they have a mortgage, they sometimes eat junk food. With a stranger, you see only the final product: the beach photo, the promotion announcement. You fill the gaps with assumptions, and those assumptions are often negative about yourself. You think, “Why don’t I have that?” without knowing the stranger’s debt or burnout.

    Second, there’s no reciprocity. In a real relationship, comparison is moderated by social norms—you both know each other’s flaws. With a stranger, there’s no back-and-forth. You’re comparing against an idealized archetype, not a real person.

    Third, strangers are archetypes. The traveler, the CEO, the fitness model—these are roles, not individuals. They represent an ideal, not a human with bad days. As sociologist Erving Goffman would say, social media is a “front stage” performance, and you’re only seeing the act.

    This is why a stranger’s post can hurt more than a friend’s. Your brain knows your friend has flaws, but a stranger is a blank canvas on which you paint your own insecurities.

    What the Brain Does: Pain, Dopamine, and Mirror Neurons

    Neuroscience offers a fascinating look at why comparison feels so visceral. Brain imaging studies using fMRI show that social rejection and social comparison activate the anterior cingulate cortex and the insula—regions also associated with physical pain. So when you see a stranger’s success and feel a pang of envy, your brain is literally processing it as a form of pain.

    There’s also a dopamine angle. Seeing others’ success triggers dopamine responses tied to anticipated rewards. Your brain thinks, “That could be me,” and releases a hit of motivation. But when your own life doesn’t match, the “prediction error”—the gap between expectation and reality—produces a negative affective state. It’s a letdown, a chemical disappointment.

    Mirror neurons add another layer. When you watch someone’s experience, your brain activates the same networks as if you were living it. This is why a stranger’s vacation video can feel so immersive—you’re almost there. But it also means you feel the emotional weight of their lives, even if they’re not real to you.

    The Algorithmic Amplifier

    Social media platforms don’t just host comparison; they actively amplify it. Algorithms are designed to keep you engaged, and content that triggers strong emotions—like envy or aspiration—tends to perform well. Luxury lifestyles, perfect bodies, and dramatic success stories generate likes, comments, and shares.

    This creates a feedback loop. The algorithm notices you linger on a travel post, so it shows you more travel posts. Before long, your feed is a curated stream of highlight reels, and the comparison engine never turns off.

    As the “Facebook Envy” study by Krasnova and colleagues (2013) found, envy from passive browsing is a primary driver of the “social media paradox”: users feel more connected yet more miserable. The algorithm doesn’t care about your well-being; it cares about your attention.

    The Sociological View: Status Competition on a Global Scale

    Sociologists frame social media comparison as a modern form of status competition. In the past, you competed with your village or neighborhood. Now, your “comparison class” includes global elites—celebrities, influencers, and billionaires. This is a rigged game.

    Sociologists point to the concept of “relative deprivation”: you feel deprived not because of absolute lack, but because others seem to have more. When your comparison class expands to include the top 1% of the world, the gap feels insurmountable. This leads to the “compare and despair” loop, where no matter what you achieve, it never feels like enough.

    Social media also quantifies status in ways that didn’t exist before. Likes, followers, and shares are visible metrics of approval. They turn status into a number, and numbers are always comparable. This makes the comparison more concrete and more painful.

    Can Comparison Be Good?

    Not all comparison is bad. Psychologists distinguish between benign envy and malicious envy. Benign envy can motivate self-improvement—you see someone’s success and think, “I can do that too.” Malicious envy breeds hostility or schadenfreude.

    Social media tends to blur this distinction. Because you don’t know the stranger, it’s harder to feel benign envy. The lack of context makes it easier to feel malicious—or to simply feel bad about yourself.

    But you can use comparison constructively. If you follow people who are a step ahead of you in a realistic way—not global elites, but peers with similar starting points—you can turn upward comparison into a learning tool.

    Breaking the Cycle: Practical Steps

    You don’t have to quit social media entirely to reduce the damage. Here are evidence-based strategies:

    • Limit passive scrolling. The 2018 study showed that passive use is the problem. Engage actively—comment, share, message—instead of just browsing.
    • Curate your feed. Unfollow accounts that trigger negative comparison. Follow people who post authentic content, including struggles.
    • Practice gratitude. When you notice envy, write down three things you’re grateful for. This shifts your focus to your own life.
    • Remember the highlight reel. Remind yourself that posts are edited. The beach photo doesn’t show the sunburn or the credit card bill.
    • Take breaks. Set app limits or schedule digital detoxes. Your brain needs time to recalibrate.

    These steps won’t eliminate comparison—it’s a human instinct—but they can help you manage it.

    The Bigger Picture

    Understanding why we compare ourselves to strangers on social media isn’t just about personal well-being. It’s about recognizing that the platforms are designed to exploit an ancient brain mechanism. The comparison engine is not a bug; it’s a feature. The more you compare, the more you engage, and the more revenue the platform generates.

    By being aware of this, you can take back some control. You can choose what to feed your brain and how to interpret what you see. The goal isn’t to stop comparing altogether—that would be impossible. It’s to compare wisely, with context and compassion for yourself.

    Social media has turned a survival instinct into a daily habit, but understanding the mechanics can help you resist the trap. Your brain isn’t broken; it’s reacting to a world it wasn’t designed for. By recognizing the curated nature of online content, the algorithmic push toward envy, and the neurological pain of comparison, you can make conscious choices about what you consume. The next time a stranger’s post makes you feel small, remember: you’re seeing their highlight reel, not their life. And your own life—messy, imperfect, and real—is still the one worth living.

    Summary

    • Social comparison theory (Festinger, 1954) says humans have an innate drive to evaluate themselves against others, a drive that social media exploits 24/7.
    • Upward comparisons (to those seen as better off) dominate social media due to curated highlight reels, leading to envy and depressive symptoms.
    • Comparing to strangers is worse than comparing to peers because there is no context, no reciprocity, and strangers become idealized archetypes.
    • Brain imaging shows that social comparison activates pain regions (anterior cingulate cortex, insula), making the experience physically distressing.
    • Algorithms amplify comparison by surfacing content that triggers strong emotions, keeping you engaged in a “compare and despair” loop.
    • You can break the cycle by limiting passive scrolling, curating your feed, practicing gratitude, and remembering that posts are edited highlights.

    FAQ

  • iOS vs Android: A Balanced Comparison for Smartphone Buyers

    iOS vs Android: A Balanced Comparison for Smartphone Buyers

    Choosing between iOS and Android is one of the most debated decisions in tech. With Android holding roughly 70% of the global market and iOS around 28%, both platforms have massive followings. But the right choice depends on your priorities: budget, customization, privacy, or ecosystem integration.

    This guide breaks down the key differences in plain language, from pricing and updates to security and app stores. Whether you’re a first-time buyer or considering switching, you’ll get a clear picture of what each platform offers—and what it costs.

    Market Share and Scale

    Android dominates globally with about 70-72% of the market, while iOS holds 27-29%. However, these numbers flip in certain regions: iOS leads in the U.S. (around 55-60%), Japan, and parts of Western Europe, while Android is dominant in India, Latin America, Africa, and most of Asia. This regional split often reflects price sensitivity and local carrier preferences.

    Operating System: Open vs. Closed

    The core difference is that Android is open-source (based on Linux), while iOS is proprietary (Unix-based). This means Android can be modified by manufacturers and users, leading to a huge variety of devices. iOS runs only on Apple hardware, giving Apple tight control over the experience.

    For users, this translates to customization: Android allows launchers, widgets, and even sideloading apps (installing outside the official store). iOS has added widgets and app icon changes, but still restricts sideloading (except in the EU due to new laws). If you like tweaking your phone, Android is the playground; if you prefer a consistent, polished experience, iOS is simpler.

    App Stores: Curation vs. Flexibility

    The Apple App Store is known for strict review, which means fewer malicious apps but also more rules for developers. Google Play is more permissive, with faster approvals but a higher risk of malware. For most users, both stores have millions of apps, but Android’s openness means you can also download apps from anywhere—a double-edged sword.

    Updates: Who Gets Them and for How Long?

    Apple controls both hardware and software, so all supported iPhones get the latest iOS at the same time. Android updates depend on the manufacturer and carrier; Google Pixel phones get updates first, but other brands often lag months or never receive them. In terms of longevity, iPhones typically receive 5-7 years of OS updates, while Android flagships from Samsung and Google now promise 7 years, but budget Android phones often get only 1-2 years.

    Hardware and Price: From Budget to Premium

    iPhones range from about $429 (iPhone SE) to $1,599 (Pro Max). Android spans from under $100 budget phones to over $2,000 foldables. If you’re on a tight budget, Android offers more options. But iPhones often hold their value longer and have consistent build quality. Repairability varies: Apple has improved self-repair, but parts pairing limits third-party fixes; some Android phones (like Fairphone) are designed for repairability, while others are glued shut.

    Privacy and Security: Perception vs. Reality

    iOS is generally considered more privacy-focused, with features like App Tracking Transparency and on-device processing. Android is more open, which can lead to higher malware rates and fragmented security patches. However, both platforms offer encryption, biometrics, and password managers. Neither is hack-proof, but iOS has a reputation for stricter privacy controls.

    Ecosystem Lock-In: Apple vs. Google

    Apple’s ecosystem (iPhone, iPad, Mac, Watch, AirPods) integrates seamlessly with AirDrop, Handoff, and iCloud. Google’s ecosystem (Android, Gmail, Drive, Photos, Assistant) works well with Windows PCs. Switching costs are real: moving photos, messages, and app data is possible but imperfect. If you’re already invested in one ecosystem, that can be a deciding factor.

    Regulatory Changes and the Future

    The EU’s Digital Markets Act forced Apple to allow alternative app stores and sideloading in Europe (starting iOS 17.4 in 2024). Both companies face antitrust scrutiny in the U.S. Apple adopted RCS in iOS 18 (2024), improving cross-platform messaging. These changes are blurring the lines, but the core differences remain.

    Developer Economics: Who Pays More?

    Both Apple and Google charge 15-30% commissions on app sales, with reduced rates for small businesses. Developers often release iOS-first because users spend more money there, even though Android has more users. This affects app availability and pricing, but for consumers, most major apps are on both platforms.

    Which Should You Choose?

    • Budget-conscious: Android wins with more affordable options.
    • Long-term use: iOS wins on update longevity, but Android flagships are catching up.
    • Power users: Android wins for customization and sideloading.
    • Privacy-focused: iOS generally wins, but privacy-conscious Android users can take steps.

    Ultimately, try both in a store. The best phone is the one that feels right in your hand and fits your daily needs.

    Both iOS and Android are excellent platforms, each with strengths and weaknesses. Your choice should align with your budget, technical comfort, and ecosystem preferences. As the market evolves, the gap is narrowing, but the fundamental trade-offs remain. Take your time, compare specific models, and pick what works for you.

    Summary

    • Android has ~70% global market share; iOS ~28%, but iOS leads in the U.S. and some wealthy regions.
    • iOS is closed and curated; Android is open and customizable.
    • iPhones get updates for 5-7 years; Android varies from 1-7 years depending on brand.
    • Android offers cheaper phones; iPhones hold value longer.
    • iOS is generally more privacy-focused; Android has more malware risk but more flexibility.

    FAQ

    Q: Which platform is more secure, iOS or Android?
    A: iOS is generally considered more secure due to its closed ecosystem and strict app review, but Android has improved with Google Play Protect. Both are vulnerable if you sideload apps or jailbreak/root.

    Q: Can I switch from iPhone to Android easily?
    A: Yes, but it takes effort. Use Google’s ‘Switch to Android’ app to transfer contacts, photos, and messages. Some app data (like WhatsApp chats) may not transfer seamlessly.

    Q: Do Android phones get updates as long as iPhones?
    A: Flagship Androids from Samsung and Google now promise 7 years of updates, matching iPhones. Budget Androids often get only 1-2 years.

    Q: Is Android really free?
    A: Android itself is open-source, but most phones include Google services, which are proprietary. You can buy phones without Google (like Amazon Fire tablets), but they lack Google Play.

    Q: Which is better for gaming?
    A: Both are capable, but iPhones often have more powerful GPUs and optimized games. Android offers more emulators and sideloading options for retro gaming.

  • The Best Video Editing Tools: Free and Paid Options Compared

    The Best Video Editing Tools: Free and Paid Options Compared

    Video editing has never been more accessible. From a teenager with a smartphone to a Hollywood post-production house, there’s a tool for every skill level and budget. But with so many options, how do you choose? This guide breaks down the leading free and paid video editors, highlighting their strengths and ideal use cases. Whether you’re a beginner cutting your first vlog or a professional colorist, you’ll find the right fit here.

    The Evolution of Video Editing

    Video editing has come a long way from the days of tape-to-tape linear editing. The 1990s brought non-linear editing (NLE) with tools like Avid and Premiere, allowing editors to access any frame instantly. Then came the consumer boom: iMovie (1999), Windows Movie Maker (2000), and YouTube (2005) democratized video creation. Today, the creator economy and short-form platforms like TikTok and Reels have made video editing a daily habit for millions. The latest shift is AI integration—auto-captions, scene detection, and text-based editing are now standard features.

    Understanding Key Concepts

    Before diving into tools, let’s clarify some jargon:

    • NLE (Non-Linear Editor): The core architecture of all modern editors. It lets you access any part of your video randomly, like a word processor, rather than in a fixed order.
    • Proxy editing: Editing low-resolution copies of your footage for smooth performance, then swapping to high-res for the final export. Essential for 4K and 8K work.
    • Codecs & containers: H.264/H.265 are common for delivery, ProRes/DNxHR for intermediate editing, and RAW for cinema cameras. The container is the file format (like .mp4 or .mov).
    • Color correction vs. grading: Correction fixes exposure and white balance; grading sets the mood and look (e.g., teal and orange for blockbusters).
    • GPU acceleration: Using your graphics card to speed up rendering and effects. Critical for smooth 4K editing.

    The Best Paid Video Editing Tools

    Adobe Premiere Pro

    • Price: $22.99/month (single app)
    • Platform: Windows, Mac
    • Key Strength: Industry standard, deep integration with After Effects, vast plugin ecosystem.

    Premiere Pro is the go-to for many professionals, from YouTubers to corporate video teams. Its timeline is flexible, and the integration with After Effects for motion graphics is seamless. The subscription model includes regular updates and cloud features. If you’re collaborating with a team, Premiere’s shared projects and Adobe Team Projects are robust.

    Final Cut Pro

    • Price: $299 one-time
    • Platform: Mac only
    • Key Strength: Optimized for Apple Silicon, magnetic timeline, fast rendering.

    Final Cut Pro is a favorite among Mac users. Its magnetic timeline automatically snaps clips together, preventing gaps and simplifying edits. It’s incredibly fast on M1/M2 chips, and the one-time price is a relief compared to subscriptions. The downside: it’s Mac-only, so if you switch to Windows, you’ll need to learn a new tool.

    DaVinci Resolve Studio

    • Price: $295 one-time (free version available)
    • Platform: Windows, Mac, Linux
    • Key Strength: Best-in-class color grading, node-based workflow.

    DaVinci Resolve is the industry standard for color grading. The Studio version adds features like noise reduction, HDR grading, and collaborative tools. The node-based workflow is powerful but has a learning curve. The free version is so capable that many professionals use it for everything except the most advanced features.

    Avid Media Composer

    • Price: ~$24.99/month or $1,299 perpetual
    • Platform: Windows, Mac
    • Key Strength: Standard in film/TV broadcast, collaborative workflows.

    If you’re aiming for Hollywood, Avid is the tool. It’s been used on countless films and TV shows. Its media management and collaboration features are unmatched. However, it’s overkill for most solo creators, and the interface feels dated compared to modern tools.

    Vegas Pro

    • Price: ~$299–$499
    • Platform: Windows
    • Key Strength: Long-standing consumer/prosumer favorite, intuitive timeline.

    Vegas Pro has been around for decades. It’s known for its straightforward timeline and powerful audio tools. It’s a solid choice for Windows users who want a one-time purchase without the complexity of DaVinci.

    The Best Free Video Editing Tools

    DaVinci Resolve (Free)

    • Price: $0
    • Platform: Windows, Mac, Linux
    • Key Strength: Professional color grading, no watermark, unlimited tracks.

    The free version of DaVinci Resolve is a game-changer. It includes most of the Studio features, including professional color grading, multi-cam editing, and audio post-production. There’s no watermark and no time limit. The only limitations are some advanced effects and collaboration features. For beginners, the learning curve is steep, but the payoff is huge.

    CapCut

    • Price: $0 (freemium)
    • Platform: Windows, Mac, Mobile, Web
    • Key Strength: TikTok/Reels/Shorts optimized, AI features, templates.

    CapCut is the darling of the short-form video world. It’s free, with a Pro tier for extra features. It offers auto-captions, background removal, and a huge library of templates and effects. It’s incredibly easy to use, making it perfect for social media creators. The mobile app is especially popular.

    Shotcut

    • Price: $0 (open source)
    • Platform: Windows, Mac, Linux
    • Key Strength: Cross-platform, open-source, wide format support.

    Shotcut is a powerful open-source editor that runs on all major platforms. It supports a wide range of formats and has a clean interface. It’s a great choice for Linux users or those who prefer open-source software. The learning curve is moderate.

    OpenShot

    • Price: $0 (open source)
    • Platform: Windows, Mac, Linux
    • Key Strength: Beginner-friendly, simple interface.

    OpenShot is one of the easiest editors to learn. It has a simple drag-and-drop interface and basic effects. It’s perfect for absolute beginners who just want to cut clips together. However, it lacks advanced features like color grading.

    HitFilm Express

    • Price: $0 (freemium)
    • Platform: Windows, Mac
    • Key Strength: VFX/compositing focus, good for beginners.

    HitFilm Express is a free editor with built-in visual effects and compositing tools. It’s great for beginners who want to add effects without learning After Effects. The free version includes a lot, but some advanced features require a paid upgrade.

    iMovie

    • Price: Free with Apple devices
    • Platform: Mac, iOS
    • Key Strength: Simple, elegant, good for beginners.

    iMovie comes free on every Mac and iPhone. It’s perfect for quick edits, trailers, and simple projects. It’s not as powerful as Final Cut Pro, but it’s a great starting point. The mobile version is surprisingly capable.

    Clipchamp

    • Price: Free (Microsoft)
    • Platform: Web, Windows
    • Key Strength: Browser-based, integrated with Windows 11, stock library.

    Clipchamp is Microsoft’s answer to easy video editing. It’s web-based, so you can use it anywhere, and it’s integrated into Windows 11. It includes a stock library and templates. The free tier is generous, with paid plans for more features.

    Kdenlive

    • Price: $0 (open source)
    • Platform: Windows, Mac, Linux
    • Key Strength: Feature-rich open-source alternative.

    Kdenlive is another open-source editor that’s more advanced than Shotcut or OpenShot. It supports multi-track editing, effects, and transitions. It’s a good middle ground for Linux users who need more power.

    How to Choose the Right Tool for You

    For Beginners and Casual Creators

    If you’re just starting, prioritize ease of use. CapCut is perfect for short-form social media. iMovie (Mac) or Clipchamp (Windows) are great for simple projects. OpenShot is also beginner-friendly. You don’t need advanced features yet—focus on learning the basics.

    For Professionals and Commercial Editors

    If you’re editing for a living, reliability and industry compatibility matter. Premiere Pro is the standard in corporate and agency work. Avid is essential for film/TV. DaVinci Resolve Studio is the best for color grading. Many pros use a combination, like Premiere for editing and DaVinci for color.

    For YouTubers and Social Media Creators

    Speed and captions are key. CapCut is the fastest for short-form. For long-form YouTube, Premiere Pro with plugins like AutoCaptions is powerful. DaVinci Resolve free is also excellent for quality. AI features like auto-reframe are now essential—check if your tool has them.

    For Filmmakers and Colorists

    If you’re serious about color, DaVinci Resolve is non-negotiable. The free version is used by professionals for grading. Final Cut Pro is efficient for Mac users. Premiere is flexible for workflow. Consider RAW support and HDR capabilities.

    For Open-Source and Privacy Advocates

    If you want no cost and no telemetry, Shotcut, OpenShot, and Kdenlive are excellent. They’re community-driven and respect your privacy. DaVinci Resolve free is also a great choice, though it’s not open-source.

    The Future of Video Editing

    The market is growing, with a projected increase from $1.2 billion in 2023 to over $2 billion by 2030. The trend is toward subscription models, but one-time purchases like Final Cut Pro and DaVinci Resolve Studio remain popular. Free tools are becoming more powerful—DaVinci Resolve free is a prime example. AI is the next frontier, with features like auto-captions and scene detection becoming standard. As a creator, you have more options than ever. The best tool is the one that fits your workflow and budget.

    Choosing the right video editing tool depends on your needs, budget, and platform. For beginners, free tools like CapCut and iMovie are perfect. For professionals, Premiere Pro and DaVinci Resolve Studio are industry standards. And for those who want professional quality without the price tag, DaVinci Resolve free is unbeatable. Try a few, and see which one feels right. Happy editing!

    Summary

    • Free tools are powerful: DaVinci Resolve free offers professional color grading, while CapCut is ideal for short-form social media.
    • Paid tools offer depth: Premiere Pro is the industry standard, Final Cut Pro is great for Mac users, and DaVinci Resolve Studio is best for color.
    • Consider your platform: Mac users have Final Cut Pro and iMovie; Windows users have Vegas Pro and Clipchamp; Linux users have Shotcut and Kdenlive.
    • AI is the future: Auto-captions, scene detection, and auto-reframe are becoming standard features.
    • Subscription vs. one-time: Adobe and Avid are subscription-based, while Final Cut Pro and DaVinci Resolve Studio are one-time purchases.

    FAQ

    Q: What is the best free video editing software?
    A: DaVinci Resolve is widely considered the best free option due to its professional color grading and no watermark. CapCut is also excellent for social media creators.

    Q: Is Final Cut Pro worth the one-time cost?
    A: If you’re a Mac user and need a fast, efficient editor without a subscription, Final Cut Pro is worth it. It’s optimized for Apple Silicon and has a magnetic timeline that speeds up editing.

    Q: Can I use DaVinci Resolve for professional work?
    A: Absolutely. The free version is used by professionals for color grading and editing. The Studio version adds advanced features like noise reduction and collaboration tools.

    Q: What’s the difference between color correction and color grading?
    A: Color correction fixes technical issues like exposure and white balance. Color grading sets the mood and style, like making a scene look warm or cinematic.

    Q: Do I need a powerful computer for video editing?
    A: It depends on the resolution and effects. For 4K editing, a modern CPU and GPU are recommended. Many tools support proxy editing, which lets you edit low-res copies for smoother performance.