
Tag: statistics

  • Most U.S. Adults Say They Lack Basic Statistical Skills: What That Means for You

    Most U.S. Adults Say They Lack Basic Statistical Skills: What That Means for You

    A recent study from Penn State highlights a striking gap: more than half of U.S. adults report they lack basic statistical understanding. This isn’t about being bad at math it’s about feeling lost when reading a poll, interpreting a medical risk, or making sense of a data chart. With data driving decisions in health, finance, and politics, this self-perceived gap has real consequences.

    The study, published by Penn State researchers, relies on self-reports rather than a test of actual skills. So, it’s a measure of confidence, not necessarily competence. But even if some people underestimate their abilities, the finding points to a widespread discomfort with numbers that deserves attention. In a world where algorithms shape our news feeds and A/B tests influence product design, statistical literacy is no longer a niche skill—it’s a civic one.

    Why Statistical Literacy Matters More Than Ever

    You don’t need to be a data scientist to feel the effects of statistics. When you read that a new drug reduces risk by 50%, do you know what that actually means? If a poll says Candidate A leads by 3 points, should you care about the margin of error? These are everyday decisions—choosing a treatment, voting, or even understanding weather forecasts—that rely on basic statistical thinking.

    Statistical literacy isn’t about solving equations. It’s about interpreting numbers in context. It’s the difference between knowing that a correlation isn’t causation, or that a small sample can’t represent a whole population. Without these skills, people are more likely to be misled by cherry-picked data or sensational headlines.

    The Penn State study taps into this concern. By asking adults whether they feel they understand basic statistical concepts, it reveals a confidence gap. While the exact percentage isn’t given in the brief, “more than half” suggests a majority feel unprepared. That’s a lot of people navigating a data-heavy world with self-doubt.

    What Self-Reported Data Really Tells Us

    One important nuance: the study measures what people say about themselves, not what they actually know. This is different from giving a test and finding that half fail. Self-reports can be skewed by modesty, imposter syndrome, or even overconfidence.

    For example, a person who aced a statistics course in college might still say they lack understanding because they haven’t used those skills in years. On the other hand, someone who knows very little might overestimate their skills—a classic Dunning-Kruger effect. So, the finding is about perception, not a hard measure of ability.

    Still, perception matters. If people feel they can’t understand statistics, they’re less likely to engage with data, question numbers, or seek out information. That can lead to apathy or poor decisions. The study’s approach is valid as a signal of cultural discomfort with statistics.

    The Roots of Statistical Illiteracy

    Why do so many adults feel this way? Part of the blame lies in education. Many school curricula focus on formulas and computations—like calculating a standard deviation—rather than on interpreting what those numbers mean. Students learn to crunch numbers but not to ask, “Does this statistic make sense?”

    Another factor is the way data is presented in the media. Infographics often simplify complex statistics into flashy visuals without explaining the nuances. Confusing axes, misleading proportions, or missing context can make even accurate data seem incomprehensible. Over time, people may feel that statistics are either too hard or too manipulative to bother with.

    There’s also a cultural element. In the U.S., math anxiety is common, and many adults proudly admit they were “never good at math.” This isn’t a neutral statement; it’s a badge of identity for some. That attitude can discourage people from building the skills they do have.

    The Real-World Consequences

    When half the country feels statistically illiterate, it’s not just a personal problem. It affects public health, finance, and democracy. During the pandemic, people had to interpret risk percentages, vaccine efficacy rates, and case numbers—all statistical concepts. Those who couldn’t were more likely to be swayed by misinformation.

    In finance, a lack of statistical understanding can lead to bad investments or falling for scams. If you can’t read a chart or understand the concept of average returns, you might make risky choices. And in politics, polls and polling averages are used to predict outcomes. Voters who don’t understand margin of error might take a poll as gospel, even when it’s within a statistical dead heat.

    Even in tech, where this study got attention on Hacker News, statistical literacy is key. Understanding A/B tests, benchmark comparisons, and AI model evaluations requires a basic grasp of statistics. Without it, users can’t critically assess new tools or claims made by tech companies.

    What Can Be Done?

    Improving statistical literacy isn’t about forcing everyone to take a stats class. It’s about changing how numbers are taught and communicated. In schools, that means emphasizing interpretation over calculation. Instead of just teaching how to find a mean, students should learn what a mean can hide—like outliers.

    For the general public, better data communication is essential. Newspapers and websites should present statistics with context: what’s the sample size, what’s the margin of error, what’s the baseline? Simple changes like using natural frequencies (“1 in 10”) instead of percentages (“10%”) can make a big difference.

    Tools and technology can also help. Interactive dashboards, data visualizations with clear labels, and AI assistants that explain statistics in plain language could bridge the gap. For instance, a well-designed chart can make a complex dataset understandable at a glance.

    On an individual level, it’s never too late to learn. Resources like online courses, books, and even YouTube videos can demystify statistics. The key is to start with real-world examples—like understanding a weather forecast or a sports statistic—rather than abstract theory.

    The Penn State study is a wake-up call. It shows that many of us feel unprepared to understand the numbers that shape our lives. But with effort from educators, communicators, and learners, we can close that gap.

    The finding that more than half of U.S. adults say they lack basic statistical understanding is both a warning and an opportunity. It’s a warning because in a data-driven world, feeling lost with numbers can lead to poor decisions. But it’s an opportunity because perception isn’t destiny—with better education and communication, we can all become more confident in interpreting statistics. The next time you see a percentage or a chart, take a moment to question it. That’s the first step toward statistical literacy.

    Summary

    • More than half of U.S. adults report lacking basic statistical understanding, according to a Penn State study.
    • The study is based on self-reports, meaning it reflects perceived confidence, not actual tested ability.
    • Statistical literacy involves interpreting data, not just doing math, and is crucial for health, finance, and civic decisions.
    • Education and media often focus on calculation over interpretation, contributing to this gap.
    • Improvements can come from teaching applied statistics, clearer data presentation, and using tools that explain numbers in plain language.

    FAQ

    Q: What exactly is statistical literacy?
    A: Statistical literacy is the ability to understand and critically evaluate statistical information, such as averages, probabilities, margins of error, and data visualizations. It’s not about doing complex calculations, but about interpreting what numbers mean in context.

    Q: Does the study mean half of U.S. adults failed a statistics test?
    A: No. The study asked adults to report whether they feel they understand basic statistical concepts. It measures self-perceived understanding, not actual performance on a test.

    Q: Why is this finding important?
    A: Because statistical literacy affects how we make decisions about health, finance, and politics. If many people feel they don’t understand statistics, they may be more vulnerable to misinformation or poor choices.

    Q: What can I do to improve my own statistical understanding?
    A: Start with real-world examples you care about, like sports stats or weather forecasts. Look for resources that explain statistics in plain language, and practice asking questions like “What’s the sample size?” or “Is this a correlation or causation?”

    Q: How can schools and media help?
    A: Schools can focus more on interpreting data rather than just calculating it. Media can present statistics with context, like margins of error and baselines, and use clear visualizations.
  • The Dunning-Kruger Effect: A Real Cognitive Bias or Just a Statistical Illusion?

    The Dunning-Kruger Effect: A Real Cognitive Bias or Just a Statistical Illusion?

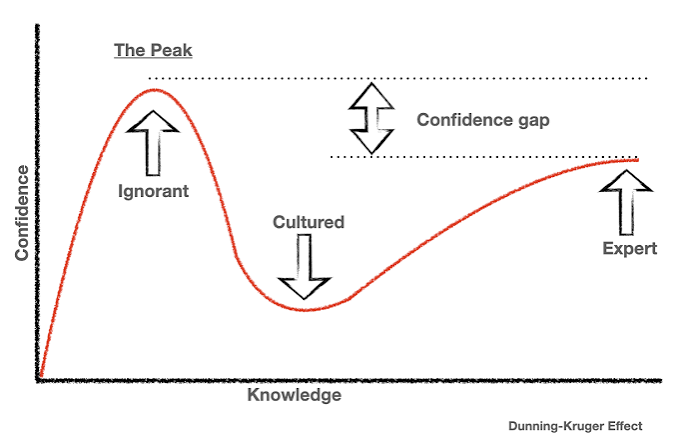
    You’ve probably heard of the Dunning-Kruger effect: the idea that incompetent people are too ignorant to know they’re incompetent, so they overestimate their abilities. It’s become a cultural touchstone, used to explain everything from bad drivers to political pundits. But what if this famous phenomenon is not a quirk of the human mind, but rather a quirk of statistics? A 2020 paper suggests just that, arguing that the Dunning-Kruger effect may be largely a data artefact—a mirage created by the way we analyze numbers, not a real psychological bias.

    This isn’t just academic squabbling. The Dunning-Kruger effect has been cited in countless articles, books, and management seminars. If it’s not real, we might need to rethink some of our assumptions about self-awareness and competence. But before we throw the concept out, let’s dive into the debate. We’ll explore the original research, the statistical critique, and what both sides have to say. By the end, you’ll have a clearer picture of whether the Dunning-Kruger effect is a genuine insight into human nature or a statistical illusion that has fooled us all.

    The Original Dunning-Kruger Effect: A Quick Recap

    In 1999, psychologists Justin Kruger and David Dunning published a landmark study titled “Unskilled and unaware of it.” They asked participants to take tests in logic, grammar, and humor, and then asked them to rate their own performance. The results were striking: those who scored in the bottom quartile (the lowest 25%) rated themselves as being in the 60th to 70th percentile—meaning they thought they were above average, when in fact they were well below. Conversely, those in the top quartile often underestimated their performance, rating themselves slightly below where they actually fell.

    The explanation Dunning and Kruger offered was that the same cognitive deficits that cause poor performance also prevent people from recognizing their incompetence. In other words, if you lack the skills to do something well, you also lack the skills to know you’re doing it badly. This “double burden” of ignorance became the core of the Dunning-Kruger effect, and it quickly entered popular culture as a meme, a management training talking point, and a way to explain everything from political polarization to vaccine hesitancy.

    The 2020 Critique: A Statistical Artefact?

    Fast forward to 2020, and a team of researchers from Carnegie Mellon University and the University of Toronto published a paper with a provocative title: “The Dunning-Kruger effect is probably not real.” Their argument was not that the original studies were fabricated, but that the pattern of results could be explained by statistical artefacts—specifically, regression to the mean and measurement error—without any need for a psychological bias.

    Let’s break down these concepts with an analogy. Imagine you’re a basketball coach trying to evaluate your players’ shooting ability. You have them take a series of shots, and you also ask them to rate how good they think they are. Both measures are imperfect: a player might have an off day (measurement error), and if you pick the worst performers from one day, they’re likely to do better the next time just by chance (regression to the mean).

    Now, suppose you compare the players’ self-ratings to their actual performance. The players who scored lowest on the shooting test might have had a particularly bad day, but their self-rating reflects their overall ability, which is probably higher than that one bad performance. So they appear to overestimate themselves. Conversely, the top performers might have had a lucky day, but their self-rating is based on their average ability, which is lower than that one great performance. So they appear to underestimate themselves. The result? A pattern that looks exactly like the Dunning-Kruger effect, but it’s purely a statistical illusion.

    The 2020 researchers ran simulations to show that random data with no true bias can produce the classic Dunning-Kruger “inverted U” pattern when analyzed the same way. They argued that when you control for these statistical artefacts, the effect size shrinks dramatically or disappears entirely.

    The Defense: Dunning and Kruger Respond

    David Dunning and Justin Kruger have not taken this critique lying down. They’ve defended their original findings on several fronts:

    First, they argue that the statistical critique is not new. In their original 1999 paper, they addressed concerns about regression to the mean and designed their studies to minimize its impact. For example, they used quartile splits and multiple measures to ensure that the effect wasn’t just a statistical fluke.

    Second, they point to subsequent research that has replicated the effect using different methodologies. For instance, studies using peer ratings (where others assess a person’s competence) have shown that poor performers are indeed unaware of their deficiencies. Longitudinal designs, which track people over time, have also found evidence consistent with the cognitive explanation.

    Third, they argue that the statistical critique explains some of the pattern but not all of it. Even after controlling for regression artefacts, a residual effect remains that suggests a real cognitive bias. In other words, the Dunning-Kruger effect is not just a mirage; there’s something real underneath.

    The Broader Context: The Replication Crisis

    The 2020 critique is part of a larger movement in psychology known as the “replication crisis.” Over the past decade, researchers have found that many famous psychological findings don’t hold up when re-tested with larger samples and more rigorous methods. The Dunning-Kruger effect is one of the most widely cited findings, so it’s no surprise that it has come under scrutiny.

    This debate highlights the importance of statistical literacy. When we hear about a study, we often assume the results are straightforward. But in reality, data can be messy, and the way we analyze it can create patterns that don’t reflect reality. The Dunning-Kruger controversy is a perfect example of why we need to be cautious about accepting psychological findings at face value.

    What Does This Mean for You?

    So, is the Dunning-Kruger effect real or not? The honest answer is: it’s complicated. The 2020 critique raises valid methodological concerns, but it doesn’t definitively prove that the effect is entirely a statistical artefact. Dunning and Kruger’s defense also has merit, and the weight of evidence from other studies suggests that there is at least some cognitive bias at play.

    However, the debate has a practical takeaway: we should be humble about our own abilities, but also humble about our confidence in psychological research. The Dunning-Kruger effect may not be as robust as we thought, but the underlying idea—that people often have poor insight into their own competence—still resonates with many real-world experiences. Whether it’s a statistical illusion or a genuine bias, the lesson remains: we could all benefit from seeking feedback and being open to the possibility that we might not be as good as we think.

    The Dunning-Kruger effect is a fascinating phenomenon, but its status as a real cognitive bias is now under question. The 2020 statistical critique shows that the pattern can emerge from data artefacts alone, but the original authors and subsequent research suggest there’s more to the story. As with many scientific debates, the truth likely lies somewhere in between. For now, the Dunning-Kruger effect remains a useful reminder of the limits of self-awareness—whether it’s a quirk of the mind or a quirk of numbers.

    Summary

    • The Dunning-Kruger effect, proposed in 1999, suggests that incompetent people overestimate their abilities, while competent people underestimate them.
    • A 2020 paper argued that this effect may be a statistical artefact, caused by regression to the mean and measurement error, not a real cognitive bias.
    • The original authors defend their findings, citing methodological precautions and subsequent replications.
    • The debate is part of the broader replication crisis in psychology, highlighting the need for rigorous statistical analysis.
    • The practical takeaway: be humble about your abilities and about the robustness of psychological research.

    FAQ

    Q: What is the Dunning-Kruger effect?
    A: The Dunning-Kruger effect is a cognitive bias where people with low ability at a task overestimate their ability, while people with high ability underestimate it. It was first described by Justin Kruger and David Dunning in 1999.

    Q: Why do some researchers think it’s a statistical artefact?
    A: A 2020 paper argued that the pattern can be explained by regression to the mean and measurement error. When you compare self-assessments to performance, extreme scores are likely to be partly due to chance, creating an apparent over/underestimation pattern without any real bias.

    Q: Did Dunning and Kruger respond to the critique?
    A: Yes, they defended their original findings, saying they had already addressed regression artefacts in their original study, and that subsequent research using different methods (like peer ratings) supports the cognitive explanation.

    Q: Is the Dunning-Kruger effect still considered real?
    A: The scientific community is divided. The 2020 critique raises valid concerns, but many researchers believe there is still evidence for a genuine effect. The debate is ongoing, and more research is needed to settle it.

    Q: What can we learn from this debate?
    A: It reminds us to be critical of psychological findings and to understand that statistical analysis can sometimes create illusions. It also reinforces the importance of seeking feedback and being open to learning about our own limitations.